Nonperishable goods, paper products and soap have been flying off shelves at American stores. Snacks and produce are selling more, too. Sunscreen? Not so much.
Maxwell Posner/NPR
As shutdowns and cancellations became more widespread last week, buyers continued stocking up on disinfectants and canned goods (and so much oat milk!). As anyone who went shopping can attest, there was also a run on toilet paper.
But according to Nielsen, Americans also increasingly bought snacks for stress-eating — like potato chips and chocolate. And they were filling the fridge with fresh produce and perishables like meat and eggs.
No parties means no vegetable party platters, though. Also not in the shopping cart: Sunscreen. (Remember, unless you're under a shelter-in-place order, you can go outside, as long as you avoid other people!)
Here are some of the items that have seen big sales increases, according to Nielsen.
source: npr.org
America's Shopping List: Here's What We're Buying The Most
Nonperishable goods, paper products and soap have been flying off shelves at American stores. Snacks and produce are selling more, too. Sunscreen? Not so much.
Maxwell Posner/NPR
As shutdowns and cancellations became more widespread last week, buyers continued stocking up on disinfectants and canned goods (and so much oat milk!). As anyone who went shopping can attest, there was also a run on toilet paper.
But according to Nielsen, Americans also increasingly bought snacks for stress-eating — like potato chips and chocolate. And they were filling the fridge with fresh produce and perishables like meat and eggs.
No parties means no vegetable party platters, though. Also not in the shopping cart: Sunscreen. (Remember, unless you're under a shelter-in-place order, you can go outside, as long as you avoid other people!)
Here are some of the items that have seen big sales increases, according to Nielsen.
"Unparalleled Challenge" - Inside America's First Locked-Down Major City, "Everything's Out Of Our Control"
"Unparalleled Challenge" - Inside America's First Locked-Down Major City, "Everything's Out Of Our Control"
The number of confirmed COVID-19 cases in the US has more than doubled in the last several days. California Governor Gavin Newsom has issued a state-wide "stay at home" order amid the virus outbreak - the strongest and most restrictive measure passed by a governor yet.
On Tuesday, there were about 5,700 confirmed cases in the US. But by Thursday the number exploded to 11,500. Now, on Friday morning, confirmed cases stand at 14,000.
The announcement comes after San Francisco and the surrounding Bay Area issued 'shelter in place' orders after a surge of deaths and confirmations in the state. As of Friday morning, there are 18 virus-related deaths.
Several days into one of the most extreme lockdowns, Bay Area residents have been forced to stay at home, only allowed to leave for essential travel, such as shopping for groceries, medications, fuel, caring for others, and exercise.
NBC News spoke with one resident, Trish Tracey, who had to shutter her restaurant on Tuesday in the Mission district. She laid off her entire kitchen staff of 17 employees and has tried to renegotiate her lease.
"Everything is out of our control," Tracey said.
The uncertainty of where the city is in the pandemic curve has left everyone confused. Strict social distancing rules have been enforced to slowdown infections to prevent local hospitals from becoming overburden with virus patients.
"The goal is to get up and running again and put all my employees back to work," Tracey said. "I wish I could say with certainty that would happen, and I'm very determined, and I lasted five years because of that, but everything is on pretty shaky ground right now."
The mass lockdown in San Francisco is serving as the blueprint of how other local governments in the state might have to resort to Martial law-style lockdowns. Other states, such as New York and Maryland, could be days or weeks away from a major lockdown to flatten the curve.
Bay Area hospitals have started seeing an influx of COVID-19 patients in recent weeks:
"This is a challenge unparalleled to any challenge I have faced in the last 28 years of my career," Dr. Baldev Singh, a pulmonary critical care physician in nearby San Jose.
Singh warned that the local hospital system could experience a worker shortage.
"Protecting your teammates is as important as ever, as the number of infected individuals needing support is anticipated to exceed the number of healthy providers able to serve those in need."
Another problem for local hospitals is an influx of virus patients could lead to a shortage of hospital beds and ICU-level treatment for the most vulnerable, and this is the point when mortality rates could surge.
On Thursday, Newsom estimated 56% of the state's population, about 25.5 million people, will become infected.
Governor Gavin Newsom makes a major announcement on California’s response to the COVID-19 outbreak. https://t.co/VlQM38OkYK
— Office of the Governor of California (@CAgovernor)
As the local economy grinds to a halt, tens of thousands of people have already lost their jobs, grocery stores run out of food, millions forced to shelter in place and watch Netflix, and the hospital system at risk of being overrun with patients, here are some views inside America's first locked-down city:
San Francisco airport. Ghost town. Most shops and services closed. We also did not get screened or asked a question about our health or where we came from. pic.twitter.com/Mo0DKtfdR7
— Mike Snodgrass (@water_boy01235)
Mike Snodgrass@water_boy01235
San Francisco airport. Ghost town. Most shops and services closed. We also did not get screened or asked a question about our health or where we came from.
helicopter was over San Francisco around 2:30 this afternoon and it was a ghost town. All the busy spots were empty, and we couldn't find any traffic in the city
What does a "typical" day in the Bay Area look like right now? From a ghost town in Jack London Square to an empty movie theatre in San Francisco, here's what we found in different cities. How are you passing the time? https://t.co/QeJBsMOpa4pic.twitter.com/3tkRZ5xwNX
— ABC7 News (@abc7newsbayarea)
ABC7 News
✔@abc7newsbayarea
What does a "typical" day in the Bay Area look like right now? From a ghost town in Jack London Square to an empty movie theatre in San Francisco, here's what we found in different cities. How are you passing the time? http://abc7news.com/coronavirus
Currently the empty streets of downtown San Francisco!we are a ghost town! Not my photos shared by a group member of our San Francisco natives group on fb. pic.twitter.com/bHVWerWVvf
— Michelle Tuegel (@michelle_tuegel)
Michelle Tuegel@michelle_tuegel
Currently the empty streets of downtown San Francisco!we are a ghost town! Not my photos shared by a group member of our San Francisco natives group on fb.
Iconic San Francisco landmark Ghirardelli Square. Normally swamped by tourist & SF residents alike. Today, a ghost town in broad daylight as we shelter in place. pic.twitter.com/MRfUN6RSxX
— Chuck Austin (@Giant_Chuck)
Chuck Austin@Giant_Chuck
Iconic San Francisco landmark Ghirardelli Square. Normally swamped by tourist & SF residents alike. Today, a ghost town in broad daylight as we shelter in place.
The coronavirus has actually made San Francisco a damn near ghost town. You can finally find parking. But on a serious note, seeing so many empty streets and buildings is so weird. pic.twitter.com/BpsSlyjESN
— Reggie, DoT (@Thot_Cop_69)
Reggie, DoT@Thot_Cop_69
The coronavirus has actually made San Francisco a damn near ghost town. You can finally find parking. But on a serious note, seeing so many empty streets and buildings is so weird.
And as we’ve noted before, when a city or region misses the containment window by implementing social distancing measures too late, cases and deaths tend to surge, residents become anxious, and what happens next just like what’s about to occur in the UK, is that the Bay Area could soon see troop deployment on streets to maintain order.
"Unparalleled Challenge" - Inside America's First Locked-Down Major City, "Everything's Out Of Our Control"
"Unparalleled Challenge" - Inside America's First Locked-Down Major City, "Everything's Out Of Our Control"
The number of confirmed COVID-19 cases in the US has more than doubled in the last several days. California Governor Gavin Newsom has issued a state-wide "stay at home" order amid the virus outbreak - the strongest and most restrictive measure passed by a governor yet.
On Tuesday, there were about 5,700 confirmed cases in the US. But by Thursday the number exploded to 11,500. Now, on Friday morning, confirmed cases stand at 14,000.
The announcement comes after San Francisco and the surrounding Bay Area issued 'shelter in place' orders after a surge of deaths and confirmations in the state. As of Friday morning, there are 18 virus-related deaths.
Several days into one of the most extreme lockdowns, Bay Area residents have been forced to stay at home, only allowed to leave for essential travel, such as shopping for groceries, medications, fuel, caring for others, and exercise.
NBC News spoke with one resident, Trish Tracey, who had to shutter her restaurant on Tuesday in the Mission district. She laid off her entire kitchen staff of 17 employees and has tried to renegotiate her lease.
"Everything is out of our control," Tracey said.
The uncertainty of where the city is in the pandemic curve has left everyone confused. Strict social distancing rules have been enforced to slowdown infections to prevent local hospitals from becoming overburden with virus patients.
"The goal is to get up and running again and put all my employees back to work," Tracey said. "I wish I could say with certainty that would happen, and I'm very determined, and I lasted five years because of that, but everything is on pretty shaky ground right now."
The mass lockdown in San Francisco is serving as the blueprint of how other local governments in the state might have to resort to Martial law-style lockdowns. Other states, such as New York and Maryland, could be days or weeks away from a major lockdown to flatten the curve.
Bay Area hospitals have started seeing an influx of COVID-19 patients in recent weeks:
"This is a challenge unparalleled to any challenge I have faced in the last 28 years of my career," Dr. Baldev Singh, a pulmonary critical care physician in nearby San Jose.
Singh warned that the local hospital system could experience a worker shortage.
"Protecting your teammates is as important as ever, as the number of infected individuals needing support is anticipated to exceed the number of healthy providers able to serve those in need."
Another problem for local hospitals is an influx of virus patients could lead to a shortage of hospital beds and ICU-level treatment for the most vulnerable, and this is the point when mortality rates could surge.
On Thursday, Newsom estimated 56% of the state's population, about 25.5 million people, will become infected.
Governor Gavin Newsom makes a major announcement on California’s response to the COVID-19 outbreak. https://t.co/VlQM38OkYK
— Office of the Governor of California (@CAgovernor)
As the local economy grinds to a halt, tens of thousands of people have already lost their jobs, grocery stores run out of food, millions forced to shelter in place and watch Netflix, and the hospital system at risk of being overrun with patients, here are some views inside America's first locked-down city:
San Francisco airport. Ghost town. Most shops and services closed. We also did not get screened or asked a question about our health or where we came from. pic.twitter.com/Mo0DKtfdR7
— Mike Snodgrass (@water_boy01235)
Mike Snodgrass@water_boy01235
San Francisco airport. Ghost town. Most shops and services closed. We also did not get screened or asked a question about our health or where we came from.
helicopter was over San Francisco around 2:30 this afternoon and it was a ghost town. All the busy spots were empty, and we couldn't find any traffic in the city
What does a "typical" day in the Bay Area look like right now? From a ghost town in Jack London Square to an empty movie theatre in San Francisco, here's what we found in different cities. How are you passing the time? https://t.co/QeJBsMOpa4pic.twitter.com/3tkRZ5xwNX
— ABC7 News (@abc7newsbayarea)
ABC7 News
✔@abc7newsbayarea
What does a "typical" day in the Bay Area look like right now? From a ghost town in Jack London Square to an empty movie theatre in San Francisco, here's what we found in different cities. How are you passing the time? http://abc7news.com/coronavirus
Currently the empty streets of downtown San Francisco!we are a ghost town! Not my photos shared by a group member of our San Francisco natives group on fb. pic.twitter.com/bHVWerWVvf
— Michelle Tuegel (@michelle_tuegel)
Michelle Tuegel@michelle_tuegel
Currently the empty streets of downtown San Francisco!we are a ghost town! Not my photos shared by a group member of our San Francisco natives group on fb.
Iconic San Francisco landmark Ghirardelli Square. Normally swamped by tourist & SF residents alike. Today, a ghost town in broad daylight as we shelter in place. pic.twitter.com/MRfUN6RSxX
— Chuck Austin (@Giant_Chuck)
Chuck Austin@Giant_Chuck
Iconic San Francisco landmark Ghirardelli Square. Normally swamped by tourist & SF residents alike. Today, a ghost town in broad daylight as we shelter in place.
The coronavirus has actually made San Francisco a damn near ghost town. You can finally find parking. But on a serious note, seeing so many empty streets and buildings is so weird. pic.twitter.com/BpsSlyjESN
— Reggie, DoT (@Thot_Cop_69)
Reggie, DoT@Thot_Cop_69
The coronavirus has actually made San Francisco a damn near ghost town. You can finally find parking. But on a serious note, seeing so many empty streets and buildings is so weird.
And as we’ve noted before, when a city or region misses the containment window by implementing social distancing measures too late, cases and deaths tend to surge, residents become anxious, and what happens next just like what’s about to occur in the UK, is that the Bay Area could soon see troop deployment on streets to maintain order.
Repositioning of drugs for use as antiviral treatments is a critical need [1]. It is commonly very badly perceived by virologists, as we experienced when reporting the effectiveness of azithromycin for Zika virus [2]. A response has come from China to the respiratory disease caused by the new coronavirus (SARS-CoV-2) that emerged in December 2019 in this country. Indeed, following the very recent publication of results showing the in vitro activity of chloroquine against SARS-CoV-2 [3], data have been reported on the efficacy of this drug in patients with SARS-CoV-2-related pneumonia (named COVID-19) at different levels of severity [4,5]. Thus, following the in vitro results, 20 clinical studies were launched in several Chinese hospitals. The first results obtained from more than 100 patients showed the superiority of chloroquine compared with treatment of the control group in terms of reduction of exacerbation of pneumonia, duration of symptoms and delay of viral clearance, all in the absence of severe side effects [4,5]. This has led in China to include chloroquine in the recommendations regarding the prevention and treatment of COVID-19 pneumonia [4,6].
There is a strong rationality for the use of chloroquine to treat infections with intracellular micro-organisms. Thus, malaria has been treated for several decades with this molecule [7]. In addition, our team has used hydroxychloroquine for the first time for intracellular bacterial infections since 30 years to treat the intracellular bacterium Coxiella burnetii, the agent of Q fever, for which we have shown in vitro and then in patients that this compound is the only one efficient for killing these intracellular pathogens [8,9]. Since then, we have also shown the activity of hydroxychloroquine on Tropheryma whipplei, the agent of Whipple's disease, which is another intracellular bacterium for which hydroxychloroquine has become a reference drug [10,11]. Altogether, one of us (DR) has treated ~4000 cases of C. burnetii or T. whipplei infections over 30 years (personal data).
Regarding viruses, for reasons probably partly identical involving alkalinisation by chloroquine of the phagolysosome, several studies have shown the effectiveness of this molecule, including against coronaviruses among which is the severe acute respiratory syndrome (SARS)-associated coronavirus [1,12,13] (Table 1). We previously emphasised interest in chloroquine for the treatment of viral infections in this journal [1], predicting its use in viral infections lacking drugs. Following the discovery in China of the in vitro activity of chloroquine against SARS-CoV-2, discovered during culture tests on Vero E6 cells with 50% and 90% effective concentrations (EC50 and EC90 values) of 1.13 μM and 6.90 μM, respectively (antiviral activity being observed when addition of this drug was carried out before or after viral infection of the cells) [3], we awaited with great interest the clinical data [14]. The subsequent in vivo data were communicated following the first results of clinical trials by Chinese teams [4] and also aroused great enthusiasm among us. They showed that chloroquine could reduce the length of hospital stay and improve the evolution of COVID-19 pneumonia [4,6], leading to recommend the administration of 500 mg of chloroquine twice a day in patients with mild, moderate and severe forms of COVID-19 pneumonia. At such a dosage, a therapeutic concentration of chloroquine might be reached. With our experience on 2000 dosages of hydroxychloroquine during the past 5 years in patients with long-term treatment (>1 year), we know that with a dosage of 600 mg/day we reach a concentration of 1 μg/mL [15]. The optimal dosage for SARS-CoV-2 is an issue that will need to be assessed in the coming days. For us, the activity of hydroxychloroquine on viruses is probably the same as that of chloroquine since the mechanism of action of these two molecules is identical, and we are used to prescribe for long periods hydroxychloroquine, which would be therefore our first choice in the treatment of SARS-CoV-2. For optimal treatment, it may be necessary to administer a loading dose followed by a maintenance dose.
Table 1. Main results of studies on the activity of chloroquine or hydroxychloroquine on coronavirusesa
Intraperitoneal or intranasal chloroquine administration, beginning 4 h prior to virus exposure: 50 mg/kg but not 10 mg/kg or 1 mg/kg reduced for the intranasal route (but not the intraperitoneal route) viral lung titres from mean ± S.D. of 5.4 ± 0.5 to 4.4 ± 1.2 in log10 CCID50/g at Day 3 (considered as not significant)
Funding: This work was supported by the French Government under the ‘Investments for the Future’ program managed by the National Agency for Research (ANR) [Méditerranée Infection 10-IAHU-03]. The funding sources had no role in the preparation, review or approval of the manuscript.
M. Wang, R. Cao, L. Zhang, X. Yang, J. Liu, M. Xu, et al.Remdesivir and chloroquine effectively inhibit the recently emerged novel coronavirus (2019-nCoV) in vitro
J. Gao, Z. Tian, X. YangBreakthrough: chloroquine phosphate has shown apparent efficacy in treatment of COVID-19 associated pneumonia in clinical studies
Multicenter Collaboration Group of Department of Science and Technology of Guangdong Province and Health Commission of Guangdong Province for Chloroquine in the Treatment of Novel Coronavirus PneumoniaExpert consensus on chloroquine phosphate for the treatment of novel coronavirus pneumonia [in Chinese]
M.A. Al-BariChloroquine analogues in drug discovery: new directions of uses, mechanisms of actions and toxic manifestations from malaria to multifarious diseases
D. Raoult, P. Houpikian, H. Tissot Dupont, J.M. Riss, J. Arditi-Djiane, P. BrouquiTreatment of Q fever endocarditis: comparison of 2 regimens containing doxycycline and ofloxacin or hydroxychloroquine
M.J. Vincent, E. Bergeron, S. Benjannet, B.R. Erickson, P.E. Rollin, T.G. Ksiazek, et al.Chloroquine is a potent inhibitor of SARS coronavirus infection and spread
D.L. Barnard, C.W. Day, K. Bailey, M. Heiner, R. Montgomery, L. Lauridsen, et al.Evaluation of immunomodulators, interferons and known in vitro SARS-coV inhibitors for inhibition of SARS-coV replication in BALB/c mice
C. Biot, W. Daher, N. Chavain, T. Fandeur, J. Khalife, D. Dive, et al.Design and synthesis of hydroxyferroquine derivatives with antimalarial and antiviral activities
M. Kono, K. Tatsumi, A.M. Imai, K. Saito, T. Kuriyama, H. ShirasawaInhibition of human coronavirus 229E infection in human epithelial lung cells (L132) by chloroquine: involvement of p38 MAPK and ERK
E. Keyaerts, S. Li, L. Vijgen, E. Rysman, J. Verbeeck, M. Van Ranst, et al.Antiviral activity of chloroquine against human coronavirus OC43 infection in newborn mice
A.H. de Wilde, D. Jochmans, C.C. Posthuma, J.C. Zevenhoven-Dobbe, S. van Nieuwkoop, T.M. Bestebroer, et al.Screening of an FDA-approved compound library identifies four small-molecule inhibitors of Middle East respiratory syndrome coronavirus replication in cell culture
An orgy of borrowing, speculation and euphoria has left the markets on the verge of catastrophe...
Financial markets have experienced the fastest ever crash over the past few weeks. Even during the dotcom bust and the Lehman crisis, stocks did not fall this quickly. In less than a month, we have seen major indices fall almost 30%, and stocks in sectors such as oil and travel down by 80%. We are experiencing terrifying daily declines not seen since the 1929 stock market crash that preceded the Great Depression.
We are at a watershed moment:the coronavirus Covid-19 is a catalyst fast bringing many long simmering problems to the boil. It is exposing the creaking financial systems around us and it will change the way economies function. Economic and financial pundits, however, have been focusing almost exclusively on the short-term effects of coronavirus and so are missing the much bigger themes at play.
Epidemiologists tell us that when it comes to the virus, we are looking at a once in a century event. It is highly contagious and highly lethal. Experts are not comparing Covid-19 to SARS or Swine Flu, but to the Spanish influenza of 1918 that killed between 50 and 100 million people worldwide.
We do not have good data on what the stock market did during the 1918 flu, but we do know that it led to a severe recession. The connection between influenza and recessions is well documented. Going as far back as the Russian flu in 1889-90, the Spanish flu in 1918, the Asian flu in 1957-58 and the Hong Kong flu of 1968-69 — they all led to recessions. This one will be no different.
But this recession will not only be driven by the economic loss of able-bodied workers, it will be helped along too by the steps political leaders take to avoid the spread of the coronavirus. In medicine, the immune system’s response can often be worse than the disease. When the body goes into septic shock, the immune system overreacts, releasing what doctors refer to as a cytokine flood, which can reduce blood to vital organs and lead to death. Sepsis is common and kills more than 10 million people a year. Today, the political reaction to Covid-19 is causing something akin to a septic shock to the global economy.
The recession is likely to be very sharp but brief. Recessions are self-regulating. De-stocking of shelves and warehouses leads to re-stocking. Collapsing low interest rates and oil prices eventually spur spending and borrowing. Government spending and central bank easing eventually feed through to the real economy. While there will be massive panic and bankruptcies today, there is little doubt that markets will be better in a year, and certainly will be in two to three years,
But the structural changes to how our economy operates, however, will be felt for decades to come. And this is in large part because we didn’t learn the lessons of the last crash.
* * *
Over the years since the 2008 crisis, central banks have been trying to stamp out every single small fire that flares up (the European crisis in 2011-12, the Chinese slowdown in 2015-16, the slowdown last year); but suppressing volatility and risk only creates bigger fires. Risk is like energy and cannot be destroyed. It can only be transformed.
Forest fires are a useful analogy. California has infrequent, devastating forest fires; the Mexican state of Baja California has many small frequent fires and almost no major catastrophic fires. Both states have a similar climate and vegetation, yet they have vastly different outcomes. That’s because when there are very few small fires, underbrush grows, vegetation increases and creates greater kindling for the next fire. Suppressing small risks only makes them emerge eventually as very big ones.
In politics and economics, massive change events tend to happen not in orderly sequences, but in sudden spasms, like the Arab Spring, or the collapse of the Eastern Bloc. Watching events unfold is often like watching sand grains pile slowly on top of one another until a final, random grain causes the entire pile to collapse. People knew the Arab countries were fragile and that the Eastern Bloc might eventually fall, but predicting which grain of sand would do it precipitate either was impossible.
Physicists call these transitions critical thresholds. Critical thresholds are everywhere in nature. Water at moderate temperatures is disorganised and free-flowing, yet at a given critical value, it has an abrupt transition to a solid. It’s the same with the sandpile: one grain too many can trigger collapse — but which one?
In 1987 Per Bak, Chao Tang, and Kurt Wiesenfeld found that while sandpiles may be individually unpredictable, they all behave the same way. The critical finding of their experiments was that the distribution of sand avalanches obeys a mathematical power law: The frequency of avalanches is inversely proportional to their size. Much like forest fires, the less frequent they are, the more catastrophic they are.
It’s the same with financial markets and the economy. We will experience years of quiet, interrupted by sudden avalanche. Years of slowly adding grains of sand can end abruptly — to our great surprise. Today in financial markets, many unsustainable trends have been building, and the coronavirus is merely the grain of sand that has tipped the sandpile.
* * *
It would be controversial to say that the stock market reaction to the coronavirus would not have been very big had we not been in the middle of an orgy of borrowing, speculation and euphoria. Of course, stocks would have fallen with coronavirus headlines, but it is unlikely they would have crashed the way they did without those exacerbating factors. Furthermore, without enormous underlying imbalances of high corporate debt, the prospect of poor sales would not have driven so many stocks to the verge of collapse.
This aspect of the current crisis has so far gone unreported. But not unmentioned. A few weeks before the crash, Charlie Munger, vice chairman of Berkshire Hathaway and Warren Buffett’s longtime business partner, issued a dire warning, “I think there are lots of troubles coming,” he said at the Los Angeles-based Daily Journal annual shareholders meeting. “There’s too much wretched excess.”
Speculative euphoria was at record highs. As Sir John Templeton once said, “Bull markets are born in pessimism, grow on skepticism, mature on optimism and die on euphoria.” Investors were all on the same side of the boat, and it capsized, as happens in market crashes.
Investors were buying a record amount of call options, or bets on stock prices rising further. According to SentimenTrader, by early February, “We’ve never seen this level of speculation before. Not even close.”
Asset managers were betting in record quantities on stock futures, which are instruments to bet on underlying indices. Positioning in S&P futures hit a new high as of February 11.
Hedge fund borrowing to buy stocks was at a 24-month high. They were highly confident markets would keep rising.
It was not a coincidence that there was such euphoria. Retail brokerages had announced over the past few months that they were eliminating all commissions on trading activity. Buying and selling stocks was suddenly “free”. It was like pouring truckloads of kerosene on a blaze. At Charles Schwab, daily average trading revenue exploded 74% after the change.
In scenes reminiscent of the dotcom boom, stocks were doubling overnight. Virgin Galactic Holdings, with no revenue, was worth over $6 billion dollars. Tesla, which has never made money selling cars, had a market capitalisation greater than any other car manufacturer. Its stock price quadrupled in less than three months. The market was so stretched that it would have crashed due to its own absurdity — with or without coronavirus.
The source of this “free” trading came from high frequency trading firms that are supposed to act as market makers, executing buys and sells for clients. Except that they are not really disinterested middlemen; they are running their own trading strategies to make money off retail investors. They execute the order flow of so called mom and pop investors and profit from these “dumb money” retail traders, in the words of Reuters.
The brokerages which sell retail orders receive hundreds of millions of dollars in return from the market makers. This means that, essentially the market makers are bribing the brokerages to profit from retail traders. For example, E*Trade received $188 million for selling its customer order flow last year, while TD Ameritrade made $135 million in the fourth quarter alone. The market makers are willing to pay so much because they almost never lose money — they trade fast and know where the market is going.
As Warren Buffet once said, “As they say in poker, ‘If you’ve been in the game 30 minutes and you don’t know who the patsy is, you’re the patsy.’” Retail is the patsy.
Ken Griffin is the owner of Citadel Securities the biggest market-making firm, and his business is so profitable that he has gone on one of the greatest property buying sprees of all time. In 2015 Griffin paid $60 million for multiple condo units in Miami. He paid a U.S.-record $239.96 million penthouse in New York City, a $122 million mansion in London, and over $250 million in Palm Beach properties. Market making against “dumb money” is a fabulous business.
As the mania deflated in late February, though, mom and pop were abandoned. As the crash started, market makers pulled back and provided less liquidity. Retail investors were left high and dry. It is no wonder prices fell so quickly.
The high frequency market makers have since been pleading for more capital, and rumors swirl that many are experiencing financial difficulties. The illusion of benign market makers looking after retail investors has vanished.
There are echoes here of the old problems from the Lehman crisis; but they have mutated into different forms. During the Lehman crisis, mortgage bonds were pooled together, and insurance companies and pension funds bought them. Today, retail investors have been buying popular funds known as Exchange Traded Funds (ETFs). These are easy to trade and cheap, but they have a fundamental problem. While ETFs have simple tickers like HYG, JNK, LQD that the average retail broker can trade on their screen, they are really holding hundreds of individual bonds inside of them that the investor is unaware of. These bonds are not easy to trade at a moment’s notice and are highly illiquid. But while the ETFs rose slowly and steadily, and investors poured more money in, lulled by a false sense of security.
While the ETF shares trade daily by the second, the underlying bonds are not easy to trade on their own. In the old days, insurers and pension funds bought these bonds, put them away in a drawer and never traded them. Today, though, investors expect instant liquidity from an illiquid investment. Liquidity mismatches are as old as banking itself (deposits and cash are highly liquid, while mortgages and loans are often completely illiquid); the problems of ETFs have been known all along, and the outcome has been inevitable.
As the coronavirus panic spread, the ETFs started trading at big discounts to the underlying value of the baskets of bonds. Markets are broken, and the gap is a sign of how illiquid the underlying holdings really are.
But these ETFs should never have been allowed in the first place.
In the words of Christopher Wood, an investment strategist at Jefferies, “they commoditise equity and bond investing in an insidious way which ultimately creates a dangerous illusion of liquidity. True, ETFs are cheap. But so is fast food.”
While ETFs may appear technical and unrelated to the broader problems in markets, they share the same underlying problem. We have had the illusion of safety and liquidity for some time, and it is the coronavirus that has exposed the gaping holes in financial markets.
* * *
The coronavirus won’t kill companies. But it will expose their bloated, overleveraged balance sheets. Corporate debt in companies has never been higher and has now reached a record 47% of GDP.
Rather than encouraging moderation, central bankers and policy makers have been reloading the all you can eat buffet and persuading everyone to come back for third and fourth plates. The European Central Bank and the Bank of Japan have been buying corporate bonds, and central banks have kept funding at zero rates, which has encouraged a massive increase in indebtedness over the past decade.
Central bankers have long promoted high corporate leverage because they see it as a way to stimulate demand. Even now, many economists see no problems on the horizon. In the New York Times, Nicolas Veron, a senior fellow at the Peterson Institute for International Economics in Washington, was openly mocking anyone advocating prudence, “The prophets of doom who thought that more debt was more risk have generally been wrong for the last 12 years.” Like most central bankers for the past decade, he argued, “More debt has enabled more growth, and even if you have a bit more volatility, it’s still net positive for the economy.”
But while debt has encouraged growth, it has also introduced much greater financial fragility, and so the growth is fundamentally unsound. We are now finding out that less debt, rather than lower rates is better for financial stability.
According to FactSet, 17% of the world’s 45,000 public companies haven’t generated enough cash to cover interest costs for at least the past three years. Debt has been used to finance more debt in a Ponzi fashion. The Bank for International Settlements looked at similar economic measures globally and found that the proportion of zombie companies — companies that earn too little even to make interest payments on their debt, and survive only by issuing new debt — is now higher than 12%, up from 4% in the mid 1990s.
Entire industries are zombies. The most indebted and bankruptcy prone industry has been the shale oil industry. In the last five years, over 200 oil producers filed for bankruptcy. We will see dozens if not hundreds more bankruptcies in the coming year. They were all moribund with oil at $50 dollars; they’re now guaranteed to go bust with oil at $30.
Only now, belatedly, are groups like the IMF waking up to the scale of the problem. In a recent report they warned that central banks have encouraged companies to pursue “financial risk-taking” and gorging on debt. “Corporate leverage can also amplify shocks, as corporate deleveraging could lead to depressed investment and higher unemployment, and corporate defaults could trigger losses and curb lending by banks,” the IMF wrote.
According to the IMF, a downturn only half as bad as 2008 would put $19 trillion of debt—nearly 40% of the corporate borrowing in major countries—at risk of default. The economic consequences would be horrific.
Corporate debt has doubled in the decade since the financial crisis, non-financial companies now owe a record $9.6 trillion in the United States. Globally, companies have issued $13 trillion in bonds. Much of the debt is Chinese, and their companies will struggle to repay any of it given the lockdown and the breakdown in supply chains.
We have not even begun to see the full extent of the corporate bond market meltdown. One little discussed problem is that a large proportion of the debt is “junk”, i.e. lowly rated. An astonishing $3.6 trillion in bonds are rated “BBB”, which is only one rating above junk. These borderline bonds account for 54% of investment-grade corporate bonds, up from 30% in 2008. When recessions happen, these will be downgraded and fall into junk category. Many funds that cannot own junk bonds will become forced sellers. We will see an absolute carnage of forced selling when the downgrades happen. Again, the illusion of safety and liquidity will be exposed by the coronavirus.
* * *
The average family is encouraged to save money for a rainy day, in case they are fired, or they face hardship. Saving some money is considered prudent. It’s quite different for business. Companies pocket the profits in the good years and ask Uncle Sam to bail them out in the bad years. Heads shareholders win, tails the taxpayer loses.
Industry can’t be blamed for not expecting an act of God or force majeure, but in the past 30 years we have seen two Gulf Wars, 9/11, SARS, MERS, Swine Flu, the Great Financial Crisis, etc. Saving for a rainy day should only be expected in cyclically sensitive industries.
But rather than do that, companies have been engaging in a rather more reckless strategy: borrowing to buyback shares. This may boost their Return on Equity (ROE), but it is not remotely prudent and makes their companies highly vulnerable. Borrowing to prop up their own shares means they have less on hand when hard times come.
According to Barons, “Stock buybacks within the S&P 500 index totaled an estimated $729 billion in 2019, down from a record $806 billion in 2018.”
And then along came coronavirus.
Of those industries that are now seeking a bailout, none has saved for a rainy day. Boeing, the poster boy of financial engineering and little real engineering, bought back over $100 billion worth of stock over the past few years. Today it is asking the government for a backstop to its borrowing.
According to Bloomberg, since 2010, the big US airlines have spent 96% of their free cash flow on stock buybacks. Today, they’re asking US taxpayers for $25 billion.
Airline CEOs have been handsomely paid while not saving for a rainy day. Delta Airline’s CEO Ed Bastian made the most, earning nearly $15 million in total compensation. American CEO Doug Parker $12 million, while United CEO Oscar Munoz earned total compensation last year of $10.5 million.
The cruise liners were little different. Over the past decade, Carnival Cruises paid $9.2 billion dollars in dividends to its billionaire owners and bought back $6.7 billion of shares. Royal Caribbean, which is a smaller company, paid out $2.7 billion in dividends and $1.6 billion in buybacks. And the smallest cruise liner Norwegian Cruise Line spent $1.3 billion on share buybacks.
For years, the cruise lines have triumphally proclaimed massive dividends and buybacks. For example, Carnival proudly announced in 2018. “In just three years, we have doubled our quarterly dividend and invested $3.5 billion in Carnival stock.”
Cruise lines have no real claim to any bailout. They pay no taxes due to a legal loophole, and all their vessels fly the flags of Liberia, Panama and the Marshall Islands. Furthermore, their owners tend to be billionaires with more than enough financial wherewithal to recapitalise their own businesses. Their shareholders are not among the 1%. They’re among the 0.01% of richest people in the world. In the worst-case scenario, the US has a highly efficient bankruptcy process. Bondholders of today become shareholders of tomorrow, and the companies can have a fresh start. Bondholders would only be more than happy to own the equity of these companies.
Banks, too, will inevitably be asking for bailouts before this is over. Banks have among the most aggressive stock buyback programs of any industry, with some repurchasing a staggering 10% of their outstanding shares annually. The eight biggest banks have announced they will suspend their share buybacks for the next two quarters due to the COVID-19 pandemic on the global economy. In 2019, the top eight banks bought back $108 billion of their own stock.
If any good can come of the current crisis, perhaps it is exposing the irresponsibility of share buybacks and lack of prudence of most companies.
* * *
Monetary policy was one of the mechanisms employed in response to the last crisis, in the hope its effects would trickle down to the unwashed masses. Central banks bought vast amounts of treasuries and mortgage bonds to tighten financial spreads for banks and borrowers, but none of it went directly to households. It was all intermediated by the financial system and those who had access to capital.
The absurdity of the policy was perfectly illustrated recently in Europe. The European Central Bank has been busy buying bonds, and recently it bought bonds from LVMH, the luxury conglomerate owned by the world’s richest man Bernard Jean Étienne Arnault. The bonds had a negative yield, meaning that the ECB was paying LVMH to borrow. LVMH used the ECBs money to buy Tiffany.
If rates are now so low that billionaires are being paid to borrow, monetary policy has reached the limits of its usefulness.
Investors own stocks because their bond portfolios have acted like a hedge. Whenever stocks have fallen, bonds have gone up. In every downturn since the 1980s, central banks have cut rates, but most government bonds now have close to zero yields.
Extremely low interest rates and high valuations mean that any small change in interest rates will make portfolios much more volatile. If interest rates were to rise even slightly, they would vaporise many bond and stock portfolios. The margin of safety in bonds and stocks has diminished rapidly as rates have approached zero.
The world is now upside down. Many investors now buy stocks for current income and buy bonds to trade given how volatile they have become. Things cannot hold.
What do high frequency market making, share buybacks and high corporate debt have in common? They are supposedly tools to make trading, growth and returns on capital more efficient and cheaper, yet they have made the system more fragile and less resilient. Perhaps returns on capital and cheapness of market orders and ETFs are less important than stability and anti-fragility, i.e. designing systems that are robust in the face of stress.
We have seen the fragility in supply chains in the recent crisis.When the coronavirus struck in China, suddenly companies everywhere found out that outsourcing all their manufacturing and even medicines and face masks to China might be a problem.
Manufacturing has become less robust, more fragile, even if the returns on capital are better for those companies that outsource everything to China in pursuit of share buybacks.
The lessons of history are instructive. Although planting a single, genetically uniform crop might be more efficient and increase yields in the short run, low genetic diversity increases the risk of losing it all if a new pest is introduced or rainfall levels drop.
The Irish Potato Famine is one such cautionary tale of the danger of monocultures, or only growing one crop. The potato first arrived in Ireland in 1588, and by the 1800s, the Irish had used it to solve the problem of feeding a growing population. They planted the “lumper” potato variety. All of these potatoes were genetically identical to one another, and it was vulnerable to the pathogen Phytophthora infestans. Because Ireland was so dependent on the potato, one in eight Irish people died of starvation in three years during the Irish potato famine of the 1840s.
The lessons from nature are dire. In the 1920s, the Gros Michel banana was almost wiped out by a fungus known as Fusarium cubense, and banana shortages became a growing problem. The widespread planting of a single corn variety contributed to the loss of over a billion dollars worth of corn in 1970, when a fungus hit the US crop. In the 1980s, dependence upon a single type of grapevine root forced California grape growers to replant approximately two million acres of vines when the pest phylloxera attacked.
Today, China is manufacturing’s monoculture.
* * *
Against this dangerous backdrop of volatility and uncertainty, the coronavirus will now achieve the impossible. For the past few years, two ideas have floated around on the political fringes of the Left, but they have been dead on arrival. No one has seriously thought they might become government policy. Today, the Left and Right in the United States and Europe are embracing them.
Andrew Yang, a former tech executive from New York, ran a quixotic, obscure presidential campaign in the United States based on the idea that every citizen should receive a Universal Basic Income (UBI). He advocated a “Freedom Dividend”. This would be a form of universal basic income that would provide a monthly stipend of $1,000 for all Americans between the ages of 18 and 64.
Today, Trump, Pelosi, Romney and others are fully backing Yang’s idea. Respected think tanks such Brookings and Chatham House have advocated UBI. But once it is implemented, there will be no going back. Handouts will start small and grow.
The other big idea has come from Stephanie Kelton, who advised Bernie Sanders and advocates for Modern Monetary Theory (MMT). Kelton argues that in any country with its own currency, budget deficits don’t matter unless they cause inflation. The government can pay for what it needs by simply printing more money — no reason to borrow by issuing bonds. Helicopter money.
Her ideas were widely criticised across the Left and Right, ranging from Paul Krugman to Warren Buffett to Federal Reserve Chairman Jay Powell.
Yet today, the two ideas have come together. There are no atheists in foxholes. Even libertarians on Twitter are now calling for government intervention. Investors and politicians of all stripes are calling for UBI financed by MMT money issuing.
This is an epochal turning point, a great reset. The coronavirus is the grain of sand that will cause the avalanche.
For once the taboo of printing money to pay citizens is broken, we can never go back. Governments will spend money with few constraints, aided by central banks. It’s a strategy that has not worked well in emerging markets, and it did not work well in the 1970s — which has conveniently been forgotten.
Undoubtedly, the government must compensate citizens from mandatory curfews and quarantines. The short-term impacts of the lockdowns must be mitigated, but temporary policies must not become permanent political expedients.
That’s why the danger is not today or even a year from now, it’s five to ten years away, when the crisis has past, along with the reason for UBI and monetary easing. What politican will be disciplined enough to stop spending? What central banker will raise rates when it is unpopular to do so?
Today we are reaping the whirlwind of the last financial crisis. Rather than pursue lower leverage, less debt and more robust institutions and more responsible corporate behaviour, investors and companies instead learned that they would be bailed out in a crisis.
Central banks became enamored of their own success as fire fighters, and they have busily been trying to put out fires by encouraging reckless behaviour, prizing low volatility above a robust financial system, viewing “risk management” as preferring no financial corrections ever.
They should accept that sometimes putting out every single fire creates greater conflagrations. They should be humbler about the extent and limits of their power.
It looks like they’re about to learn the hard way.
Since this story was scrubbed from its original publisher's server, we've decided to host it on ours.
COVID-19 - Evidence Over Hysteria
COVID-19 - Evidence Over Hysteria
Authored by Aaron Ginn
After watching the outbreak of COVID-19 for the past two months, I’ve followed the pace of the infection, its severity, and how our world is tackling the virus. While we should be concerned and diligent, the situation has dramatically elevated to a mob-like fear spreading faster than COVID-19 itself.
When 13% of Americans believe they are currently infected with COVID-19 (mathematically impossible), full-on panic is blocking our ability to think clearly and determine how to deploy our resources to stop this virus.Over three-fourths of Americans are scared of what we are doing to our society through law and hysteria, not of infection or spreading COVID-19 to those most vulnerable.
The following article is a systematic overview of COVID-19 driven by data from medical professionals and academic articles that will help you understand what is going on (sources include CDC, WHO, NIH, NHS, University of Oxford, Stanford, Harvard, NEJM, JAMA, and several others). I’m quite experienced at understanding virality, how things grow, and data. In my vocation, I’m most known for popularizing the “growth hacking movement” in Silicon Valley that specializes in driving rapid and viral adoption of technology products. Data is data. Our focus here isn’t treatments but numbers. You don’t need a special degree to understand what the data says and doesn’t say. Numbers are universal.
I hope you walk away with a more informed perspective on how you can help and fight back against the hysteria that is driving our country into a dark place. You can help us focus our scarce resources on those who are most vulnerable, who need our help.
Note: The following graphs and numbers are as of mid-March 2020. Things are moving quickly, so I update this article twice a day. Most graphs are as of March 20th, 2020.
* * *
Total cases are the wrong metric
A critical question to ask yourself when you first look at a data set is, “What is our metric for success?”.
Let’s start at the top. How is it possible that more than 20% of Americans believe they will catch COVID-19? Here’s how. Vanity metrics — a single data point with no context. Wouldn’t this picture scare you?
Look at all of those large red scary circles!
These images come from the now infamous John Hopkins COVID-19 tracking map. What started as a data transparency effort has now molded into an unintentional tool for hysteria and panic.
An important question to ask yourself is what do these bubbles actually mean? Each bubble represents the total number of COVID-19 cases per country. The situation looks serious, yet we know that this virus is over four months old, so how many of these cases are active?
Immediately, we now see that just under half of those terrifying red bubbles aren’t relevant or actionable. The total number of cases isn’t illustrative of what we should do now. This is a single vanity data point with no context; it isn’t information or knowledge. To know how to respond, we need more numbers to tell a story and to paint the full picture. As a metaphor, the daily revenue of a business doesn’t tell you a whole lot about profitability, capital structure, or overhead. The same goes for the total number of cases. The data isn’t actionable. We need to look at ratios and percentages to tell us what to do next — conversion rate, growth rate, and severity.
Time lapsing new cases gives us perspective
Breaking down each country by the date of the first infection helps us track the growth and impact of the virus. We can see how total cases are growing against a consistent time scale.
Here are new cases time lapsed by country and date of first 100 total cases.
Here is a better picture of US confirmed case daily growth.
The United States is tracking with other European nations at doubling every three days or so. As we measure and test more Americans, this will continue to grow. Our time-lapse growth is lower than China, but not as good as South Korea, Japan, Singapore, or Taiwan. All are considered models of how to beat COVID-19. The United States is performing average, not great, compared to the other modern countries by this metric.
Still, there is a massive blindspot with this type of graph. None of these charts are weighted on a per-capita basis. It treats every country as a single entity, as we will see this fails to tell us what is going on in several aspects.
On a per-capita basis, we shouldn’t be panicking
Every country has a different population size which skews aggregate and cumulative case comparisons. By controlling for population, you can properly weigh the number of cases in the context of the local population size. Viruses don’t acknowledge our human borders. The US population is 5.5X greater than Italy, 6X larger than South Korea, and 25% the size of China. Comparing the US total number of cases in absolute terms is rather silly.
Rank ordering based on the total number of cases shows that the US on a per-capita basis is significantly lower than the top six nations by case volume. On a 1 million citizen per-capita basis, the US moves to above mid-pack of all countries and rising, with similar case volume as Singapore (385 cases), Cyprus (75 cases), and United Kingdom(3,983 cases). This is data as of March 20th, 2020.
But total cases even on a per-capita basis will always be a losing metric. The denominator (total population) is more or less fixed. We aren’t having babies at the pace of viral growth. Per-capita won’t explain how fast the virus is moving and if it is truly “exponential”.
COVID-19 is spreading, but probably not accelerating
Growth rates are tricky to track over time. Smaller numbers are easy to move than larger numbers. As an example, GDP growth of 3% for the US means billions of dollars while 3% for Bermuda means millions. Generally, growth rates decline over time, but the nominal increase may still be significant. This holds true of daily confirmed case increases. Daily growth rates declined over time across all countries regardless of particular policy solutions, such as shutting the borders or social distancing.
The daily growth data across the world is a little noisy.
Weighing daily growth of confirmed cases by a relative daily growth factor cleans up the picture, more than 1 is increasing and below 1 is declining. For all of March, the world has hovered around 1.1. This translates to an average daily growth rate of 10%, with ups and downs on a daily basis. This isn’t great, but it is good news as COVID-19 most likely isn’t increasing in virality. The growth rate of the growth rate is approximately 10%; however, the data is quite noisy. With inconsistent country-to-country reporting and what qualifies as a confirmed case, the more likely explanation is that we are increasing our measurement, but the virus hasn’t increased in viral capability. Recommended containment and prevention strategies are still quite effective at stopping the spread.
Cases globally are increasing (it is a virus after all!), but beware of believing metrics designed to intentionally scare like “cases doubling”. These are typically small numbers over small numbers and sliced on a per-country basis. Globally, COVID-19’s growth rate is rather steady. Remember, viruses ignore our national boundaries.
Viruses though don’t grow infinitely forever and forever. As with most things in nature, viruses follow a common pattern — a bell curve.
Watch the Bell Curve
As COVID-19 spreads and declines (which it will decline despite what the media tells you), every country will follow a similar pattern. The following is a more detailed graph of S. Korea’s successful defeat of COVID-19 compared also to China with thousands of more cases and deaths. It is a bell curve:
Here is a more detailed graph of S. Korea graphed against the total number of cases.
Here is a graph from Italy showing a bell curve in symptom onset and number of cases, which may point to the beginning of the end for Italy —
Bell curves is the dominant trait of outbreaks. A virus doesn’t grow linearly forever. It accelerates, plateaus, and then declines. Whether it is environmental or our own efforts, viruses accelerate and quickly decline. This fact of nature is represented in Farr’s law. CDC’s of “bend the curve” or “flatten the curve” reflects this natural reality.
It is important to note that in both scenarios, the total number of COVID-19 cases will be similar. “Flattening the curve”’s focus is a shock to the healthcare system which can increase fatalities due to capacity constraints. In the long-term, it isn’t infection prevention. Unfortunately, “flattening the curve” doesn’t include other downsides and costs of execution.
Both the CDC and WHO are optimizing virality and healthcare utilization, while ignoring the economic shock to our system. Both organizations assume you are going to get infected, eventually, and it won’t be that bad.
A low probability of catching COVID-19
The World Health Organization (“WHO”) released a study on how China responded to COVID-19. Currently, this study is one of the most exhaustive pieces published on how the virus spreads.
The results of their research show that COVID-19 doesn’t spread as easily as we first thought or the media had us believe (remember people abandoned their dogs out of fear of getting infected). According to their report if you come in contact with someone who tests positive for COVID-19 you have a 1–5% chance of catching it as well. The variability is large because the infection is based on the type of contact and how long.
The majority of viral infections come from prolonged exposures in confined spaces with other infected individuals. Person-to-person and surface contact is by far the most common cause. From the WHO report, “When a cluster of several infected people occurred in China, it was most often (78–85%) caused by an infection within the family by droplets and other carriers of infection in close contact with an infected person.
A growing body of evidence indicates that COVID-19 transmission is facilitated in confined settings; for example, a large cluster (634 confirmed cases) of COVID-19 secondary infections occurred aboard a cruise ship in Japan, representing about one fifth of the persons aboard who were tested for the virus. This finding indicates the high transmissibility of COVID-19 in enclosed spaces
Dr. Paul Auwaerter, the Clinical Director for the Division of Infectious Diseases at Johns Hopkins University School of Medicine echoes this finding,
“If you have a COVID-19 patient in your household, your risk of developing the infection is about 10%….If you were casually exposed to the virus in the workplace (e.g., you were not locked up in conference room for six hours with someone who was infected [like a hospital]), your chance of infection is about 0.5%”
According to Dr. Auwaerter, these transmission rates are very similar to the seasonal flu.
Air-based transmission or untraceable community spread is very unlikely. According to WHO’s COVID-19 lead Maria Van Kerkhove, true community based spreading is very rare. The data from China shows that community-based spread was only a very small handful of cases. “This virus is not circulating in the community, even in the highest incidence areas across China,” Van Kerkhove said.
“Transmission by fine aerosols in the air over long distances is not one of the main causes of spread. Most of the 2,055 infected hospital workers were either infected at home or in the early phase of the outbreak in Wuhan when hospital safeguards were not raised yet,” she said.
True community spread involves transmission where people get infected in public spaces and there is no way to trace back the source of infection. WHO believes that is not what the Chinese data shows. If community spread was super common, it wouldn’t be possible to reduce the new cases through “social distancing”.
“We have never seen before a respiratory pathogen that’s capable of community transmission but at the same time which can also be contained with the right measures. If this was an influenza epidemic, we would have expected to see widespread community transmission across the globe by now and efforts to slow it down or contain it would not be feasible,” said Tedros Adhanom, Director-General of WHO.
An author of a working paper from the Department of Ecology and Evolutionary Biology at Princeton University said, “The current scientific consensus is that most transmission via respiratory secretions happens in the form of large respiratory droplets … rather than small aerosols. Droplets, fortunately, are heavy enough that they don’t travel very far and instead fall from the air after traveling only a few feet.”
The media was put into a frenzy when the above authors released their study on COVID-19’s ability to survive in the air. The study did find the virus could survive in the air for a couple of hours; however, this study was designed as academic exercise rather than a real-world test. This study put COVID-19 into a spray bottle to “mist” it into the air. I don’t know anyone who coughs in mist form and it is unclear if the viral load was large enough to infect another individual As one doctor, who wants to remain anonymous, told me, “Corona doesn’t have wings”.
To summarize, China, Singapore, and South Korea’s containment efforts worked because community-based and airborne transmission aren’t common. The most common form of transmission is person-to-person or surface-based.
Common transmission surfaces
COVID-19’s ability to live for a long period of time is limited on most surfaces and it is quite easy to kill with typical household cleaners, just like the normal flu.
COVID-19 be detected on copper after 4 hours and 24 hours on cardboard.
COVID-19 survived best on plastic and stainless steel, remaining viable for up to 72 hours
COVID-19 is very vulnerable to UV light and heat.
Presence doesn’t mean infectious. The viral concentration falls significantly over time. The virus showed a half-life of about 0.8 hours on copper, 3.46 hours on cardboard, 5.6 hours on steel and 6.8 hours on plastic.
According to Dylan Morris, one of the authors, “We do not know how much virus is actually needed to infect a human being with high probability, nor how easily the virus is transferred from the cardboard to one’s hand when touching a package”
According to Dr. Auwaerter, “It’s thought that this virus can survive on surfaces such as hands, hard surfaces, and fabrics. Preliminary data indicates up to 72 hours on hard surfaces like steel and plastic, and up to 12 hours on fabric.”
COVID-19 will likely “burn off” in the summer
Due to COVID-19’s sensitivity to UV light and heat (just like the normal influenza virus), it is very likely that it will “burn off” as humidity increases and temperatures rise.
Released on March 10th, one study mapped COVID-19 virality capability by high temperature and high humidity. It found that both significantly reduced the ability of the virus to spread from person-to-person. From the study,
“This result is consistent with the fact that the high temperature and high humidity significantly reduce the transmission of influenza. It indicates that the arrival of summer and rainy season in the northern hemisphere can effectively reduce the transmission of the COVID-19.”
The University of Maryland mapped severe COVID-19 outbreaks with local weather patterns around the world, from the US to China. They found that the virus thrives in a certain temperature and humidity channel. “The researchers found that all cities experiencing significant outbreaks of COVID-19 have very similar winter climates with an average temperature of 41 to 52 degrees Fahrenheit, an average humidity level of 47% to 79% with a narrow east-west distribution along the same 30–50 N” latitude”, said the University of Maryland.
“Based on what we have documented so far, it appears that the virus has a harder time spreading between people in warmer, tropical climates,” said study leader Mohammad Sajadi, MD, Associate Professor of Medicine in the UMSOM, physician-scientist at the Institute of Human Virology and a member of GVN.
In the image below, the zone at risk for a significant community spread in the near-term includes land areas within the green bands.
Children and Teens aren’t at risk
It’s already well established that the young aren’t particularly vulnerable. In fact, there isn’t a single death reported below the age of 10 in the world and most children who test positive don’t show symptoms. As well, infection rates are lower for individuals below the age of 19, which is similar to SARS and MERS (COVID-19’s sister viruses).
According to the WHO’s COVID-19 mission in China, only 8.1% of cases were 20-somethings, 1.2% were teens, and 0.9% were 9 or younger. As of the study date February 20th, 78% of the cases reported were ages 30 to 69. The WHO hypothesizes this is for a biological reason and isn’t related to lifestyle or exposure.
“Even when we looked at households, we did not find a single example of a child bringing the infection into the household and transmitting to the parents. It was the other way around. And the children tend to have a mild disease,” said Van Kerkhove.
According to a WSJ article, children have a near-zero chance of becoming ill. They are more likely to get normal flu than COVID-19.
A World Health Organization report on China concluded that cases of Covid-19 in children were “relatively rare and mild.” Among cases in people under age 19, only 2.5% developed severe disease while 0.2% developed critical disease. Among nearly 6,300 Covid-19 cases reported by the Korea Centers for Disease Control & Prevention on March 8, there were no reported deaths in anyone under 30. Only 0.7% of infections were in children under 9 and 4.6% of cases were in those ages 10 to 19 years old
Only 2% of the patients in a review of nearly 45,000 confirmed Covid-19 cases in China were children, and there were no reported deaths in children under 10, according to a study published in JAMA last month. (In contrast, there have been 136 pediatric deaths from influenza in the U.S. this flu season.)
About 8% of cases were in people in their 20s. Those 10 to 19 years old accounted for 1% of cases and those under 10 also accounted for only 1%.
However even if children and teens are not suffering severe symptoms themselves, they may “shed” large amounts of virus and may do so for many days, says James Campbell, a professor of pediatrics at the University of Maryland School of Medicine.
Children had a virus in their secretions for six to 22 days or an average of 12 days. “Shedding virus doesn’t always mean you’re able to transmit the virus”, he notes. It is still important to consider that prolonged shedding of high viral loads from children is still a risky combination within the home since the majority of transmission occurs within a home-like confined environment.
A strong, but unknown viral effect
While the true viral capacity is unknown at this moment, it is theorized that COVID-19 is more than the seasonal flu but less than other viruses. The average number of people to which a single infected person will transmit the virus, or Ro, range from as low as 1.5 to a high of 3.0
“Every coronavirus patient in China infected on average 2.2 people a day — spelling exponential growth that can only lead to disaster. But then it started dropping, and the number of new daily infections is now close to zero.” He compared it to interest rates again: “even if the interest rate keeps dropping, you still make money. The sum you invested does not lessen, it just grows more slowly. When discussing diseases, it frightens people a lot because they keep hearing about new cases every day. But the fact that the infection rate is slowing down means the end of the pandemic is near.”
What about asymptomatic spread?
The majority of cases see symptoms within a few days, not two weeks as originally believed.
On true asymptomatic spread, the data is still unclear but increasingly unlikely. Two studies point to a low infection rate from pre-symptomatic and asymptomatic individuals. One study said 10% of infections come from people who don’t show symptoms, yet. Another WHO study reported 1.2% of confirmed cases were truly asymptomatic. Several studies confirming asymptotic spread have ended up disproven. It is important to note there is a difference between “never showing symptoms” and “pre-symptomatic” and the media is promoting an unproven narrative. Almost all people end up in the latter camp within five days, almost never the former. It is very unlikely for individuals with COVID-19 to never show symptoms. WHO and CDC claim that asymptomatic spread isn’t a concern and quite rare.
Iceland is leading the global in testing its entire population of ~300,000 for asymptomatic spread, not just those that show symptoms. They randomly tested 1,800 citizens who don’t show symptoms and, as far as they knew, were not exposed to positive individuals. Of this sample, only 19 tested positive for COVID-19, or 1.1% of the sample.
Obviously, this type of viral spread is the most concerning; however based on the level of media attention and the global size of positive infections, it seems more probable we keep looking for a COVID-19 viral trait that doesn’t exist.
Another way of looking at virality and asymptotic spread is the number of flight attendants, airport staff, or pilots that have tested positive for COVID-19. Out of the thousands of flights since November 2019, only a handful of airport and airline staff have tested positive (such as AA pilot, some BA staff, and several TSA employees).
Outside of medical and hospital staff, these individuals are in greatest contact with infected persons in confined spaces. Despite having no protective gear and most likely these people were asymptomatic, airline and airport staff aren’t likely to catch COVID-19 compared to the rest of the population. Those employed in the travel sector are infected at a lower rate than the general population or healthcare workers.
“We still believe, looking at the data, that the force of infection here, the major driver, is people who are symptomatic, unwell, and transmitting to others along the human-to-human route,” Dr. Mike Ryan of WHO Emergencies Program.
If the symptoms are so close to other less fatal coronaviruses, what is the positivity rate of those tested?
93% of people who think they are positive aren’t
Looking at the success in S. Korea and Singapore, the important tool in our war chest is measurement. If we are concerned about the general non-infected population, what is the probability those who show symptoms actually test positive? What is the chance that the cough from your neighbor is COVID-19? This “conversion rate” will show whether or not you have a cold (another coronavirus) or heading to isolation for two weeks. Global data shows that ~95% of people who are tested aren’t positive. The positivity rate varies by country.
Department of Health and Social Care
✔@DHSCgovuk
UPDATE on coronavirus (#COVID19) testing in the UK:
As of 26 February 2020, a total of 7,132 people have been tested:
: 48,492 tests, of which 1,950 (4.0% positivity rate)
Italy: 9,462 tests, of which 470 positive (at least 5.0% positivity rate).
Italy: 3,300 tests, of which 99 positive (3.0% positivity rate)
Iceland: 3,787 tests, of which 218 positive (5.7% positive rate)
France: 762 tests, of which 17 positive, 179 awaiting results (at least 2.2% positivity rate).
Austria: 321 tests, of which 2 positive, awaiting results: unknown (at least 0.6% positivity rate).
South Korea: 66,652 tests with 1766 positives 25,568 awaiting results (4.3% positivity rate).
United States: 445 concluded tests, of which 14 positive (3.1% positivity rate).
In the US, drive-thru testing facilities are being deployed around the nation. Gov. Cuomo of NY released initial data from their drive-thru testing. Out of the 600~ that was tested in a single day, ~7% were positive. Tested individuals actively show symptoms and present a doctor’s note. This result is similar to public tracking on US nationwide positivity rate.
University of Oxford’s Our World in Data attempts to track public reporting on individuals tested vs positive cases of COVID-19. For the US, it estimates 14.25% of those tested are positive.
Last week, the US was significantly behind in testing, near the bottom of all countries worldwide. As of March 20th, a week later, the US is much closer to other G8 and European countries, but there is a long way to go.
Based on the initial results and the results from other countries, the total number of positive COVID-19 cases will increase as testing increases, but the fatality rate will continue to fall and the severity case mix will fall.
In general, the size of the US population infected with COVID-19 will be much smaller than originally estimated as most symptomatic individuals aren’t positive. 93% — 99% have other conditions.
Globally, the US has a long way to go to catch up in testing. As testing expands, the total number of cases will increase, but the mild to severe case ratio will decline dramatically.
1% of cases will be severe
Looking at the whole funnel from top to bottom, ~1% of everyone who is tested for COVID-19 with the US will have a severe case that will require a hospital visit or long-term admission.
Globally, 80–85% of all cases are mild. These will not require a hospital visit and home-based treatment/ no treatment is effective.
As of mid-March, the US has a significantly lower case severity rate than other countries. Our current severe caseload is similar to South Korea. This data has been spotty in the past; however, lower severity is reflected in the US COVID-19 fatality rates (addressed later).
For context, this year’s flu season has led to at least 17 million medical visits and 370,000 hospitalizations (0.1%) out of 30–50 million infections. Recalling that only comparing aggregate total cases isn’t helpful, breaking down active cases on a per-capita basis paints a different picture on severity. This is data as of March 20th, 2020.
Declining fatality rate
As the US continues to expand testing, the case fatality rate will decline over the next few weeks. There is little doubt that serious and fatal cases of COVID-19 are being properly recorded. What is unclear is the total size of mild cases. WHO originally estimated a case fatality rate of 4% at the beginning of the outbreak but revised estimates downward 2.3% — 3% for all age groups. CDC estimates 0.5% — 3%, however stresses that closer to 1% is more probable. Dr. Paul Auwaerter estimated 0.5% — 2%, leaning towards the lower end. A paper released on March 19th analyzed a wider data set from China and lowered the fatality rate to 1.4%. This won’t be clear for the US until we see the broader population that is positive but with mild cases. With little doubt, the fatality rate and severity rate will decline as more people are tested and more mild cases are counted.
Higher fatality rates in China, Iran, and Italy are more likely associated with a sudden shock to the healthcare system unable to address demands and doesn’t accurately reflect viral fatality rates. As COVID-19 spread throughout China, the fatality rate drastically fell outside of Hubei. This was attributed to the outbreak slowing spreading to several provinces with low infection rates.
John P.A. Ioannidis is professor of medicine, of epidemiology and population health, of biomedical data science, and of statistics at Stanford University and co-director of Stanford’s Meta-Research Innovation Center recently wrote about fatality rates and how our current instrumentation is leading to faulty policy solutions:
“The one situation where an entire, closed population was tested was the Diamond Princess cruise ship and its quarantine passengers. The case fatality rate there was 1.0%, but this was a largely elderly population, in which the death rate from Covid-19 is much higher.
Projecting the Diamond Princess mortality rate onto the age structure of the U.S. population, the death rate among people infected with Covid-19 would be 0.125%. But since this estimate is based on extremely thin data — there were just seven deaths among the 700 infected passengers and crew — the real death rate could stretch from five times lower (0.025%) to five times higher (0.625%). It is also possible that some of the passengers who were infected might die later, and that tourists may have different frequencies of chronic diseases — a risk factor for worse outcomes with SARS-CoV-2 infection — than the general population. Adding these extra sources of uncertainty…”
“Reasonable estimates for the case fatality ratio in the general U.S. population vary from 0.05% to 1%.”
Looking at the US fatality, the fatality rate is drastically declining as the number of cases increases, halving every four or five days. The fatality rate will eventually level off and plateau as the US case-mix becomes apparent.
4.06% March 8 (22 deaths of 541 cases)
3.69% March 9 (26 of 704)
3.01% March 10 (30 of 994)
2.95% March 11 (38 of 1,295)
2.52% March 12 (42 of 1,695)
2.27% March 13 (49 of 2,247)
1.93% March 14 (57 of 2,954)
1.84% March 15 (68 of 3,680)
1.90% March 16 (86 of 4,503)
1.76% March 17 (109 of 6,196)
1.66% March 18 (150 of 9,003)
1.51% March 19th (208 of 13,789)
1.32% March 20th (256 of 19,383)
Source: Worldometers.info
Mapped against other countries, our fatality rate and case-mix are following a similar pattern to South Korea which is a good sign, a supposed model of how to manage COVID-19.
Here are deaths weighted by the total number of cases as of March 20th, 2020. Ranked by the total number of cases, our death rate is closer to South Korea’s than Spain’s or Italy’s.
The initial higher fatality rate for the US is trending much lower than originally estimated.
Another analysis by Nature, comparing the fatality rate (since revised down) and infectious rate of COVID-19 to other illnesses. COVID-19 is now within range of its other sisters of less potent coronaviruses.
As the global health community continues to gather and report data, the claim that “COVID-19 isn’t just like the flu” (though still severe) is looking less credible as fatality rates continue to decline and measuring of mild cases increases.
It is important to consider case-mix when looking at fatality rates. The fatality rate is significantly higher for patients with an underlying condition.
Comparing case-mix across countries with a wide range of fatality (China and Italy) and those with low fatality rates (S. Korea) reveals a stark difference in age; therefore, underlying conditions also vary significantly across countries. These two factors contribute the most to a country’s fatality rate.
Source: Goldman Sachs
Divided by most at risk and low risk, Italy had significantly more cases of high at-risk patients than Germany or Korea
Based on an initial CDC study of 2,449 COVID-19 cases (almost half of current US cases have missing demographic data), the United States case-mix looks more like S. Korea and Germany rather than China or Italy. Approximately 69% of COVID-19 cases are in the lower at-risk population of under 65, while 31% are older than 65 higher risk population.
This suggests the US will experience a declining fatality rate; however, the US has over 100 million adults with underlying and chronic illnesses that will negatively impact our fatality rate.
An older population skew within the infected population explains most of the disparity in fatality rates between high and low countries. According to a study of the fatalities of COVID-19 cases in Italy, 99% of all deaths had an underlying pathology. Only 0.8% had no underlying condition.
Most of those infected in Italy were over the age of 60, but the median age of a fatality was 80. All of Italy’s fatality under the age of 40 were males with serious pre-existing medical conditions.
This doesn’t factor in a wide variance in healthcare capacity, such as hospital beds per 1,000 citizens which could affect health outcomes; however, this doesn’t seem to be highly correlated with fatality rates at this moment.
S. Korea — 11.5
Germany — 8.3
China — 4.2
Italy — 3.4
United States — 2.9
Singapore — 2.4
So what should we do?
The first rule of medicine is to do no harm.
Local governments and politicians are inflicting massive harm and disruption with little evidence to support their draconian edicts. Every local government is in a mimetic race to one-up each other in authoritarian city ordinances to show us who has more “abundance of caution”. Politicians are competing, not on more evidence or more COVID-19 cures but more caution. As unemployment rises and families feel unbearably burdened already, they feel pressure to “fix” the situation they created with even more radical and “creative” policy solutions. This only creates more problems and an even larger snowball effect. The first place to start is to stop killing the patient and focus on what works.
Start with basic hygiene
The most effective means to reduce spread is basic hygiene. Most American’s don’t wash their hands enough and aren’t aware of how to actually wash your hands. Masks aren’t particularly effective if you touch your eyes with infected hands. Ask businesses and public places to freely distribute disinfectant wipes and hand sanitizer to the customers and patrons. If you get sick or feel sick, stay home. These are basic rules for preventing illness that doesn’t require trillions of dollars.
More data
The best examples of defeating COVID-19 requires lots of data. We are very behind in measuring our population and the impact of the virus but this has turned a corner the last few days. The swift change in direction should be applauded. Private companies are quickly developing and deploying tests, much faster than CDC could ever imagine. The inclusion of private businesses in developing solutions is creative and admirable. Data will calm nerves and allow us to utilize more evidence in our strategy. Once we have proper measurement implemented (the ability to test hundreds every day in a given metro), let’s add even more data into that funnel — reopen public life.
Available modeling data indicate that early, short to medium closures do not impact the epi curve of COVID-19 or available health care measures (e.g., hospitalizations). There may be some impact of much longer closures (8 weeks, 20 weeks) further into community spread, but that modeling also shows that other mitigation efforts (e.g., handwashing, home isolation) have more impact on both spread of disease and health care measures. In other countries, those places who closed school (e.g., Hong Kong) have not had more success in reducing spread than those that did not (e.g., Singapore).
Based on transmission evidence children are more likely to catch COVID-19 in the home than at school. As well, they are more likely to expose older vulnerable adults as multi-generational homes are more common. As well, the school provides a single point of testing a large population for a possible infection in the home to prevent community spread.
Open up public spaces
With such little evidence of prolific community spread and our guiding healthcare institutions reporting the same results, shuttering the local economy is a distraction and arbitrary with limited accretive gain outside of greatly annoying millions and bankrupting hundreds of businesses. The data is overwhelming at this point that community-based spread and airborne transmission is not a threat. We don’t have significant examples of spreading through restaurants or gyms. When you consider the environment COVID-19 prefers, isolating every family in their home is a perfect situation for infection and transmission among other family members. Evidence from South Korea and Singapore shows that it is completely possible and preferred to continue on with life while making accommodations that are data-driven, such as social distancing and regular temperature checks.
Support business and productivity
The data shows that the overwhelming majority of the working population will not be personally impacted, both individually or their children. This is an unnecessary burden that is distracting resources and energy away from those who need it the most. By preventing Americans from being productive and specializing at what they do best (their vocation), we are pulling resources towards unproductive tasks and damaging the economy. We will need money for this fight.
At this rate, we will spend more money on “shelter-in-place” than if we completely rebuilt our acute care and emergency capacity.
Americans won’t have the freedom to go help those who get sick, volunteer their time at a hospital, or give generously to a charity. Instead, big government came barrelling in like a bull in a china shop claiming they could solve COVID-19. The same government that continued to not test incoming passengers from Europe and who couldn’t manufacture enough test kits with two months' notice.
Let Americans be free to be a part of the solution, calling us to a higher civic duty to help those most in need and protect the vulnerable. Not sitting in isolation like losers.
People fear what the government will do, not an infection
Rampant hoarding and a volatile stock market aren’t being driven by COVID-19. An overwhelming majority of American’s don’t believe they will be infected. Rather hoarding behavior strongly demonstrates an irrational hysteria, from purchasing infective household masks to buying toilet paper in the troves. This fear is being driven by government action, fearing what the government will do next. In South Korea, most citizens didn’t fear infection but the government and public shaming. By presenting a consistent and clear plan that is targeted and specific to those who need the most help will reduce the volatility and hysteria. A sign the logic behind these government actions aren’t widely accepted, nor believed as rational by the American people is the existence itself of the volatility and hysteria. Over three-fourths of Americans are scared not of COVID-19 but what it is doing to our society.
In CDC’s worst-case scenario, CDC expects more than 150–200 million infections within the US. This estimate is hundreds of times bigger than China’s infection rate (30% of our population compared to 0.006% in China). Does that really sound plausible to you? China has a sub-par healthcare system, attempted to suppress the news about COVID-19 early on, a lack of transparency, an authoritarian government, and millions of Chinese traveling for the Lunar Festival at the height of the outbreak. In the US, we have a significant lead time, several therapies proving successful, transparency, a top tier healthcare system, a democratic government, and media providing ample accountability.
Infection isn’t our primary risk at this point.
Expand medical capacity
COVID-19 is a significant medical threat that needs to be tackled, both finding a cure and limiting spread; however, some would argue that a country’s authoritarian response to COVID-19 helped stop the spread. Probably not. In South Korea and Taiwan, I can go to the gym and eat at a restaurant which is more than I can say about San Francisco and New York, despite a significantly lower caseload on a per-capita basis.
None of the countries the global health authorities admire for their approach issued “shelter-in-place” orders, rather they used data, measurement,and promoted common sense self-hygiene.
Does stopping air travel have a greater impact than closing all restaurants? Does closing schools reduce the infection rate by 10%? Not one policymaker has offered evidence of any of these approaches. Typically, the argument given is “out of an abundance of caution”. I didn’t know there was such a law. Let’s be frank, these acts are emotionally driven by fear, not evidence-based thinking in the process of destroying people’s lives overnight. While all of these decisions are made by elites isolated in their castles of power and ego, the shock is utterly devastating Main Street.
A friend who runs a guy will run out of cash in a few weeks. A friend who is a pastor let go of half of his staff as donations fell by 60%. A waitress at my favorite breakfast place told me her family will have no income in a few days as they force the closure of restaurants. While political elites twiddle their thumbs with models and projections based on faulty assumptions, people’s lives are being destroyed with Marxian vigor. The best compromise elites can come up with is $2,000.
Does it make more sense for us to pay a tax to expand medical capacity quickly or pay the cost to our whole nation of a recession?Take the example of closing schools which will easily cost our economy $50 billion. For that single unanimous totalitarian act, we could have built 50 hospitals with 500+ beds per hospital.
Eliminate arcane certificate of need and expand acute medical capacity to support possible higher healthcare utilization this season.
Don’t let them forget it and vote
These days are precarious as Governors float the idea of martial law for not following “social distancing”, as well as they liked while they violate those same rules on national TV. Remember this tone is for a virus that has impacted 0.004% of our population. Imagine if this was a truly existential threat to our Republic.
The COVID-19 hysteria is pushing aside our protections as individual citizens and permanently harming our free, tolerant, open civil society. Data is data. Facts are facts. We should be focused on resolving COVID-19 with continued testing, measuring, and be vigilant about protecting those with underlying conditions and the elderly from exposure. We are blessed in one way, there is an election in November. Never forget what happened and vote.
You may ask yourself. Who is this guy? Who is this author? I’m a nobody. That is also the point. The average American feels utterly powerless right now. I’m an individual American who sees his community and loved ones being decimated without given a choice, without empathy, and while the media cheers on with high ratings.
When this is all over, look for massive confirmation bias and pyrrhic celebration by elites. There will be vain cheering in the halls of power as Main Street sits in pieces. Expect no apology, that would be political suicide. Rather, expect to be given a Jedi mind trick of “I’m the government and I helped.”
The health of the State will be even stronger with more Americans dependent on welfare, another trillion stimulus filled with pork for powerful friends, and a bailout for companies that charged us $200 change fees for nearly a decade. Washington DC will be fine. New York will still have all of the money in the world. Our communities will be left with nothing but a shadow of the longest bull market in the history of our country.
Lighten up, people. Laughter is great therapy, especially when you're shut in, frightened by misinformation on the internet, mainstream media, and from various levels of government. Feel free to share this one, as at the very least it'll lead to a conversation about the origin of viruses. Ultimately, we don't know where this one came from but please... Quit fear mongering on this. The world is not ending, the food supply chain (at least here in Northeastern North America) is not broken or even disrupted, and we'll be here hosting relevant information daily. <3 -smAsh
Lighten up, people. Laughter is great therapy, especially when you're shut in, frightened by misinformation on the internet, mainstream media, and from various levels of government. Feel free to share this one, as at the very least it'll lead to a conversation about the origin of viruses. Ultimately, we don't know where this one came from but please... Quit fear mongering on this. The world is not ending, the food supply chain (at least here in Northeastern North America) is not broken or even disrupted, and we'll be here hosting relevant information daily. <3 -smAsh
U.S. FDA approves first rapid coronavirus test with 45 minutes detection time
Kanishka Singh
(Reuters) - The U.S. Food and Drug Administration has approved the first rapid coronavirus diagnostic test, with a detection time of about 45 minutes, as the United States struggles to meet the demand for coronavirus testing.
The test’s developer, California-based molecular diagnostics company Cepheid, said on Saturday it had received an emergency use authorization from the FDA for the test, which will be used primarily in hospitals and emergency rooms. The company plans to begin shipping it to hospitals next week, it said.
The FDA confirmed its approval in a separate statement. It said the company intends to roll out the availability of its testing by March 30.
Under the current testing regime, samples must be sent to a centralized lab, where results can take days.
“With new tools like point-of-care diagnostics, we are moving into a new phase of testing, where tests will be much more easily accessible to Americans who need them,” U.S. Secretary of Health and Human Services Alex Azar said on Saturday.
The United States is not even close to meeting domestic demand for coronavirus testing. Many medical experts have predicted that delayed and chaotic testing will cost lives, potentially including those of doctors and nurses.
On Friday, Anthony Fauci, director of National Institute of Allergy and Infectious Diseases, was asked whether the United States can currently meet demand for tests.
“We are not there yet,” Fauci said.
The diagnostic test for the virus that causes COVID-19 has been designed to operate on any of Cepheid’s more than 23,000 automated GeneXpert Systems globally, the company said.
The systems do not require users to have special training to perform testing, and are capable of running around the clock, Cepheid President Warren Kocmond said in the statement.
The company did not give further details or say how much the test will cost.
The U.S. FDA has been pushing to expand screening capacity for the virus while the World Health Organization has called for “order and discipline” in the market for health equipment needed to fight the outbreak.
Reporting by Kanishka Singh in Bengaluru; Editing by Sonya Hepinstall and Daniel Wallis
source : Reuters.com
HEALTH NEWS
MARCH 21, 2020 / 4:02 PM / UPDATED 5 HOURS AGO
U.S. FDA approves first rapid coronavirus test with 45 minutes detection time
Kanishka Singh
(Reuters) - The U.S. Food and Drug Administration has approved the first rapid coronavirus diagnostic test, with a detection time of about 45 minutes, as the United States struggles to meet the demand for coronavirus testing.
The test’s developer, California-based molecular diagnostics company Cepheid, said on Saturday it had received an emergency use authorization from the FDA for the test, which will be used primarily in hospitals and emergency rooms. The company plans to begin shipping it to hospitals next week, it said.
The FDA confirmed its approval in a separate statement. It said the company intends to roll out the availability of its testing by March 30.
Under the current testing regime, samples must be sent to a centralized lab, where results can take days.
“With new tools like point-of-care diagnostics, we are moving into a new phase of testing, where tests will be much more easily accessible to Americans who need them,” U.S. Secretary of Health and Human Services Alex Azar said on Saturday.
The United States is not even close to meeting domestic demand for coronavirus testing. Many medical experts have predicted that delayed and chaotic testing will cost lives, potentially including those of doctors and nurses.
On Friday, Anthony Fauci, director of National Institute of Allergy and Infectious Diseases, was asked whether the United States can currently meet demand for tests.
“We are not there yet,” Fauci said.
The diagnostic test for the virus that causes COVID-19 has been designed to operate on any of Cepheid’s more than 23,000 automated GeneXpert Systems globally, the company said.
The systems do not require users to have special training to perform testing, and are capable of running around the clock, Cepheid President Warren Kocmond said in the statement.
The company did not give further details or say how much the test will cost.
The U.S. FDA has been pushing to expand screening capacity for the virus while the World Health Organization has called for “order and discipline” in the market for health equipment needed to fight the outbreak.
Reporting by Kanishka Singh in Bengaluru; Editing by Sonya Hepinstall and Daniel Wallis
Viruses are infectious, tiny and nasty. But are they alive?
Not really, although it depends on what your definition of "alive" is, two infectious disease doctors told Live Science.
Living beings, such as plants and animals, contain cellular machinery that allows them to self-replicate. In contrast, viruses are free forms of DNA or RNA that can't replicate on their own. [What If We Eradicated All Infectious Disease?]
Rather, viruses need to invade a living organism to replicate, said Dr. Otto Yang, a professor of medicine and microbiology, immunology and molecular genetics at the David Geffen School of Medicine at the University of California, Los Angeles.
"[Viruses are] packaged RNA or DNA," Yang told Live Science. "They make more copies of themselves by hijacking the machinery of cells to replicate themselves."
Are viruses, like the Zika virus pictured above, truly alive? (Image credit: AuntSpray/Shutterstock)
Is it alive?
Countless philosophers and scientists have debated how to define whether something is alive. According to the seven characteristics of life, all living beings must be able to respond to stimuli; grow over time; produce offspring; maintain a stable body temperature; metabolize energy; consist of one or more cells; and adapt to their environment.
However, some life-forms don't fit every single characteristic. Most hybrid animals, such as mules (a cross between a donkey and a horse), can't reproduce because they are sterile. Moreover, rocks can grow, albeit in a passive way, with new material flowing over them. But this classification problem goes away when a simpler definition of "life" is used.
"Take a cat, a plant and a rock, and leave them in a room for days," said Amesh Adalja, an infectious disease physician and an affiliated scholar at the Johns Hopkins Center for Health Security in Baltimore. "Come back, and the cat and the plant will have changed, but the rock will essentially be the same," he said.
Like a rock, most viruses would be fine if they were left indefinitely in a room, Adalja said. In addition, he noted that living beings have self-generated and self-sustaining actions — meaning they can seek out sustenance and behave in self-preserving ways. In other words, "they're taking actions to further their lives, [such as] a plant sprouting its roots to find water or an animal looking for food," Adalja said.
Something that is not alive, such as a virus, does not have self-generated or self-sustaining actions, he said.
"I don't think viruses qualify as being alive. They are, in essence, inert unless they come into contact with a living cell," Adalja said. "There are some characteristics of viruses that put them on the borderline [of being alive] — they have genetic material: DNA or RNA. It's not the same thing as a rock, but it's clearly not the same thing as even bacteria, in terms of that self-sustaining and self-generated action." [Could Humans Live Without Bacteria?]
Yang agreed, saying, "Without a cell, a virus cannot reproduce. And so from that standpoint, it's really not alive, if you consider life to be something that can reproduce by itself independently."
However, "if you loosen up your definition of life to something that can make copies of itself with help, then you could call it alive," Yang said.
It's thought that some of the very first life-forms on Earth were RNA molecules, as "RNA molecules, under the right conditions, can make copies of themselves," Yang said. "Viruses maybe evolved from that ancestor, but lost the capability to self-replicate."
Aaand, just like that - our liberty vanishes. Welcome to the giant bureaucratic overreach nightmare. If you aren't scared of COVID-19, perhaps very stupid human reactions, bloated, self perpetuating government graft will...
PA starts enforcing large-scale business shutdown Monday morning
"This is requiring all of us to confront it to change as a sacrifice and I know that sacrifice is not easy," said Pennsylvania Governor Tom Wolf in an online press briefing Sunday night.
The governor offered Pennsylvanians a sense of reasoning behind requiring what he calls non-life-sustaining businesses to close. The order will start being enforced Monday at 8 a.m.
"I've worked to be responsive and flexible so that businesses can apply for a waiver to keep their physical locations open if they perform life-sustaining work," said Wolf.
The order is facing opposition -- including lawsuits -- from interest group who said many businesses were unfairly ordered to close.
Wolf said a team of about 50 state employees were busy sorting through 10,000 waiver requests, with hopes they'd be finished and have businesses notified by Monday morning. Those businesses that do not fall within this framework will close or face penalties enforced by state and local law enforcement.
"The idea of the police going out to make sure that we had full compliance is something that I think is really important," said Wolf.
Two of the biggest questions on people's mind are just how long will this last? And when will we get over the hump?
"When we start to see that going down, that is when we're going to be able to start relaxing," said Wolf.
It's a temporary means that Wolf said will require effort beyond the finish line.
"When this time is over we will need an even greater effort to get ourselves back on our feet contact and and back on our feet so mean something different different than it did three weeks ago," said Wolf.
source wfmz.com
Aaand, just like that - our liberty vanishes. Welcome to the giant bureaucratic overreach nightmare. If you aren't scared of COVID-19, perhaps very stupid human reactions, bloated, self perpetuating government graft will...
PA starts enforcing large-scale business shutdown Monday morning
"This is requiring all of us to confront it to change as a sacrifice and I know that sacrifice is not easy," said Pennsylvania Governor Tom Wolf in an online press briefing Sunday night.
The governor offered Pennsylvanians a sense of reasoning behind requiring what he calls non-life-sustaining businesses to close. The order will start being enforced Monday at 8 a.m.
"I've worked to be responsive and flexible so that businesses can apply for a waiver to keep their physical locations open if they perform life-sustaining work," said Wolf.
The order is facing opposition -- including lawsuits -- from interest group who said many businesses were unfairly ordered to close.
Wolf said a team of about 50 state employees were busy sorting through 10,000 waiver requests, with hopes they'd be finished and have businesses notified by Monday morning. Those businesses that do not fall within this framework will close or face penalties enforced by state and local law enforcement.
"The idea of the police going out to make sure that we had full compliance is something that I think is really important," said Wolf.
Two of the biggest questions on people's mind are just how long will this last? And when will we get over the hump?
"When we start to see that going down, that is when we're going to be able to start relaxing," said Wolf.
It's a temporary means that Wolf said will require effort beyond the finish line.
"When this time is over we will need an even greater effort to get ourselves back on our feet contact and and back on our feet so mean something different different than it did three weeks ago," said Wolf.
: the theory or practice of intervening, specifically: governmental interference in economic affairs at home or in political affairs of another country
Big government - making you 'safe' by reducing the US economy to ashes.
: the theory or practice of intervening, specifically: governmental interference in economic affairs at home or in political affairs of another country


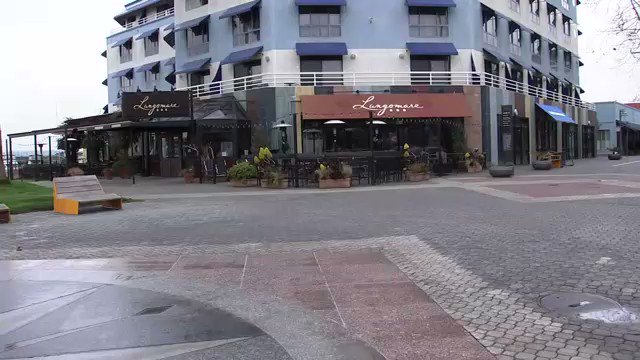


https://gov.uk/coronavirus


 will be announced later today. 17 March 2020")


 Department of Health and Social Care
 323 people are talking about this
 Matt Hancock

